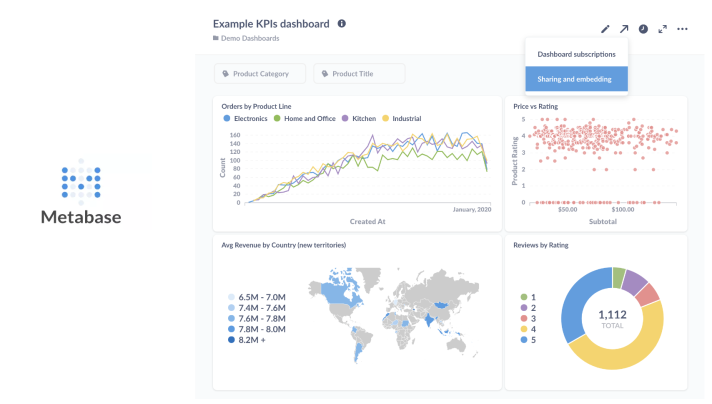
Metabase is an open source business intelligence tool that lets you create charts and dashboards using data from a variety of databases and data sources.
Features
Find below some of the main features of Metabase:
- A user-friendly Interface
- A wide array of high-quality visualizations to showcase your data
- Wide range of database support (e.g. most SQL databases are supported)
- The ability to add custom visualization plugins
- Alerts: get notified when a metric hits a certain number
- Interactive charts: customize what happens when users click on a chart
Use Cases
Find below some examples of possible use cases:
- Data exploration (explore your data using the array of data visualizations or by using the built-in SQL Lab to write queries against your data)
- Data visualization (creating interactive dashboard and other types of visualizations)
Resources
Find below some interesting links providing more information on Metabase:

