Description
Use case description - Problem statement
As data scientist, I need to extract insights and visualizations from the provided dataset to support the storytelling of the "energy balance in the EU" report.
Use case goals
- Load the data
- Query the data
- Explore the different visualization opportunities
- Select the best-fit visualization techniques
- Create the visualizations
Tools & capabilities
In order to meet the use case goals, the following tools from the portal will be leveraged:
| Tool | Description | Key capability |
|---|---|---|
| PgAdmin | PgAdmin is the most popular and feature rich Open Source administration and development platform for PostgreSQL, the most advanced Open Source database in the world. | Data load |
| PostgreSQL | PostgreSQL is a powerful, open source object-relational database system with over 30 years of active development that has earned it a strong reputation for reliability, feature robustness, and performance. | Data query |
| Apache Superset | Apache Superset is a modern data exploration and visualization platform. It is fast, lightweight, intuitive, and loaded with options that make it easy for users of all skill sets to explore and visualize their data, from simple line charts to highly detailed geospatial charts. | - Data pre-processing (null values, outbound values, ...) - Explore the different visualization opportunities - Select the best-fit visualization technique - Create the visualizations |
Dataset:
Guide
This document is meant to guide the user through the use case 1 - data visualisation. As presented in the use case description, the goal is to provide relevant visualizations through Apache Superset, having the data stored on a DB in PostgreSQL as source. The guide will be a step by step tutorial towards such objective. More in detail, each subsection covers a step of the approach, namely:
- Step 1: Initialize the resources.
- Step 2: Configure pgAdmin and connect the PostgreSQL instance.
- Step 3: Load the data.
- Step 4: Configure Apache Superset and connect the PostgreSQL database.
- Step 5: Create a dashboard and populate it with charts.
Step 1: Initialize the resources
As first step, the user should inizialize the required resources. More in particular, three instances should be launched:
- PgAdmin instance
- PostgreSQL instance
- Apache Superset instance
Initialize the pgAdmin instance
- Go on the Service Catalog section of the Portal.
- Click on the button Launch on the pgAdmin4 badge.
- Assign a name to the instance and select a group from the ones available in the list.
- Select the default configuration.
- Set your pgAdmin email and copy the auto-generated password. This will be needed to access the instance in the later stage. (NB: Instance credentials are automatically saved and accessible on the My Data section of the portal).
- Launch the instance by clicking on the launch button.
Initialize the PostgreSQL instance
- Go on the Service Catalog section of the Portal.
- Click on the button Launch on the PostgreSQL badge.
- Assign a name to the instance and select a group from the ones available in the list.
- Select the micro configuration.
- Copy the auto-generated password. This will be needed to access the instance in the later stage. (NB: Instance credentials are automatically saved and accessible on the My Data section of the portal).
- Once the instance is deployed, it will be possible to copy its host address by clicking on the related button Copy in the My Services section of the portal.
Initialize the Apache Superset instance
- Go on the Service Catalog section of the Portal.
- Click on the button Launch on the Apache Superset badge.
- Assign a name to the instance and select a group from the ones available in the list.
- Select the micro configuration.
- Set your Admin username, Admin email, Admin firstname and Admin lastname. Copy the auto-generated password. This will be needed to access the instance in the later stage. (NB: Instance credentials are automatically saved and accessible on the My Data section of the portal).
- Launch the instance by clicking on the launch button.
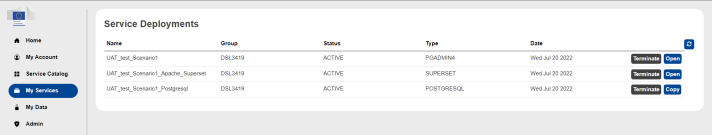
After having launch the instances, go on the My Services section of the portal to verify that all the deployed services are up and running (all three instances should be in status ACTIVE).
Step 2: Configure pgAdmin and connect the PostgreSQL instance
- From the My Services section of the portal, click on the Copy button of the PostgreSQL instance to copy the host address of the instance in the clipboard.
-
The PostgreSQL host address is in the format:
<postgreSQLHost>:5432 -
Go on the My Services section of the portal and open the pgAdmin instance.
- Login into your pgAdmin account whith the credentials defined in the configuration.
- In the main page, click on the Browser tab: this will allow you to browse on all available resources on your pgAdmin account.
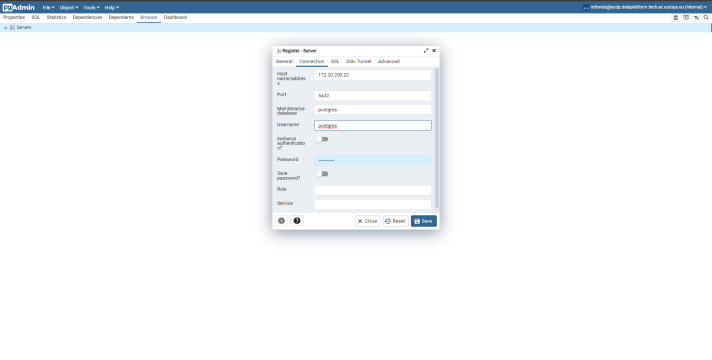
- On the Browser tab, right click on the Servers item > Register > Servers... . This will open up the configuration modal for registering a new server on our pgAdmin account: the PostgreSQL database will be added.
-
The configuration modal contains five fields that need to be compiled:
- Hostname/address: this is the hostname/address of the PostgreSQL instance. Input here the <postgresSQLHost> (see Step 2.2)
- Port: 5432
- Maintenance Database: postgres
- Username: postgres
- Password: input the PostgreSQL password defined in the configuration.
Step 3: Load the data
In order to load the data into the PostgreSQL database, we need to perform some operations on pgAdmin. Please note that pgAdmin is the management interface for PostgreSQL, so we need to use this service to interact with our DB on PostgreSQL. Finally, through pgAdmin we will:
- Create the data table
- Define the data schema for the table
- Import the data from the source file
Create the data table
- In the Browser section, go to the Schemas and expand the public schema (postgres>Databases>Schemas).
- In the public schema, right-click on Table>Create>Table.. . This will open up the configuration modal for creating a new table on our public schema: in specific, the data table will be created.
- In the configuration modal, assign a name to the table (i.e. energy_balance_eu) and click on save.
Define the schema for the data table
Please note that to import data from a csv file it is preliminarly needed to manually define the related data schema (namely, to add the columns of the table). This is achieved by following the steps:
- Right-click on the newly created table and click on Query Tool. This will open an SQL query tool (Query Editor) that will allow to perform queries on the database. Hence, the SQL query tool will be used to alter the current data schema and to add the columns present in our data source.
- Paste the following SQL query in the Query Editor:
NB: Make sure to substite name_of_your_table with the table name defined in the previous step.
- Execute the SQL query by clicking on the Play button (or by clicking F5)
- Verify that the columns has been created by checking the table properties (right click on the table name > Properties > Columns).
Import the data from the source file
- Download the data source csv file from here
- In the navbar, go on File > Preferences > Storage > Options and set the Maximum file upload size (MB) to 10000. Click on Save.
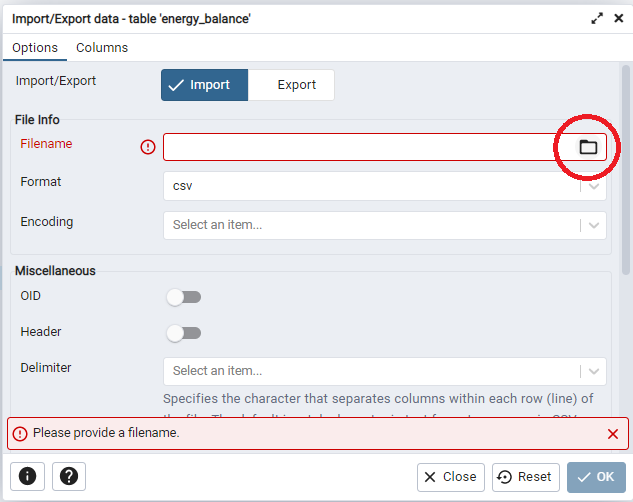
- Right-click on the newly created table and click ok Import/Export Data.... This will open an Import/Export Data tool that will allow us to import the data from the source file.
- Select the Import option.
- In the File Info section, click on the folder icon. This will open the Select file modal.
- In the navbar of the Select file modal, click on the Upload file icon.
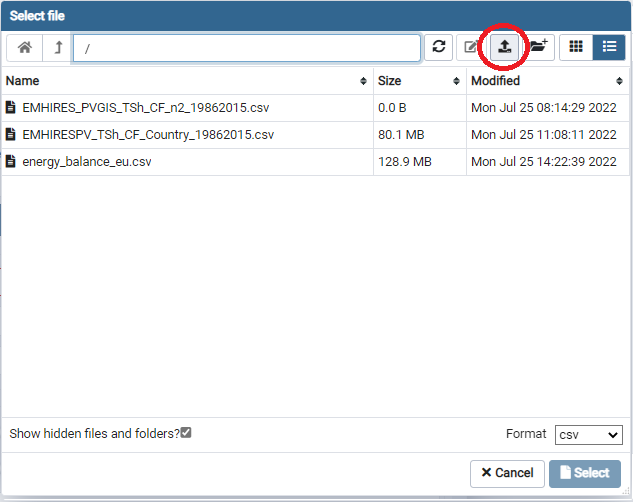
- Drop the energy_balance_eu.csv file and wait for its uploading to be done.
- The uploaded file should be now visible in the list of available files. Click on it and press Select.
- In the File Info section, select csv as Format.
- In the Miscellaneous section activate the Header option. This will allow PgAdmin to take into account that the first row of the file contains the table headers (title of the columns).
- In the Miscellaneous section, select the comma (,) as Delimiter.
- Click on Ok and wait for the import process to be done.
Step 4: Configure Apache Superset and connect the PostgreSQL database
Add the database to Apache Superset
- Go on the My Services section of the portal and open the Apache Superset instance.
- Login into your Apache Superset instance whith the credentials defined in the configuration.
- In the navbar, click on Data > Databases.
- Click on the " + DATABASE " button. This will open the Connect a database tool that will allow us to connect the PostgreSQL database to Apache Superset.
- Select PostgreSQL as database to connect.
- Enter the required PostgreSQL credentials:
- HOST: this is the hostname/address of the PostgreSQL instance. Input here the <postgreSQLHost> (see Step 2.2)
- PORT: 5432
- DATABASE NAME: postgres
- USERNAME: postgres
- PASSWORD: input the autogenerated PostgreSQL password. You can retrieve it from the My Data section of the portal.
- Click on Connect.
Add the dataset to Apache Superset
- In the navbar, click on Data > Datasets.
- Click on the " + DATASETS " button. This will open the Add dataset tool that will allow us to connect the dataset from the PostgreSQL database to Apache Superset.
- In the DATABASE field, select the database that has been connected to Apache Superset in the previous step.
- In the SCHEMA field, select public.
- In the SEE TABLE SCHEMA field, select the table that contains the data imported in the previous steps (i.e. energy_balance_eu).
- If the dataset has been connected succesfully, it should be visible in the list of available datasets.
- For the newly connected dataset, in the Actions section press on the Edit icon.
- Go on COLUMNS and tick the property Is temporal and Default datetime for the column time_period. This will allow Apache Superset to deal with such column as a temporal dimension, and this will be needed for all time-related data visualizations (eg. bar charts, time series, ...).
- Save the changes by clicking on the Save button.
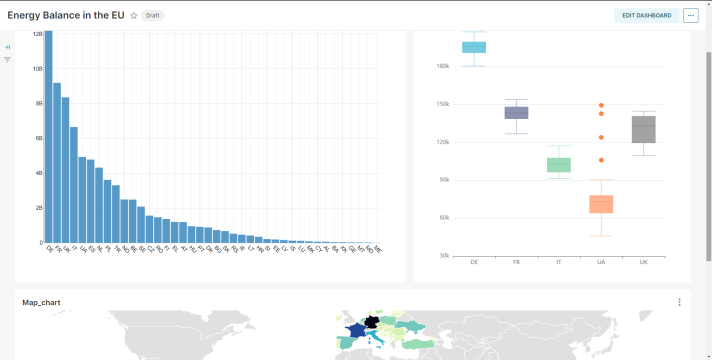
Step 5: Create a dashboard and populate it with charts
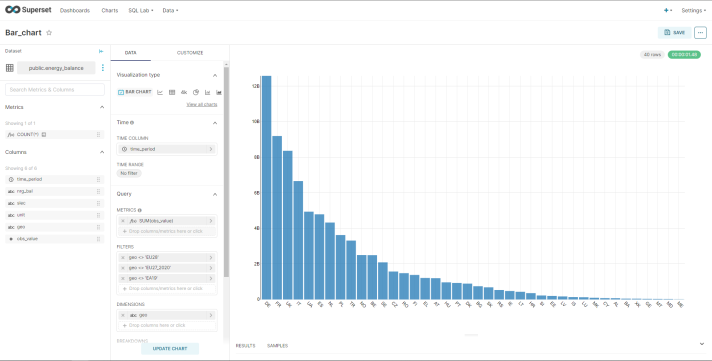
Create a Pie chart/Bar chart/Box plot
- In the navbar, click on Charts and then on the button + CHART to create a new chart.
- In the Choose a dataset section, select the dataset connected in the previous step.
- In the Choose chart type section, select the Pie Chart/Bar chart/Box plot and click on CREATE NEW CHART.
- Assign the new chart a name by editing the text Add the name of the chart.
- In the DATA tab, select time_period as TIME COLUMN.
- In the DATA tab:
- Select geo as GROUP BY (for the pie-chart)
- Select geo as SERIES (for the bar chart and box plot)
- Select Original value for the TIME GRAIN (for the box plot).
- In the DATA tab, click on Add metric > SIMPLE and select obs_value as COLUMN and SUM as aggregate. Click on SAVE.
- In the DATA tab, click on Add filter > SIMPLE, select geo as column, Not equal to as operator and EA19 as Filter value. (Repeat the exact same operation twice by putting EU27_2020 and EU28 as filter value. This will exclude these columns from the chart, since these rappresents the aggregated values at EU level).
- Click on RUN and then on SAVE to save the created chart.
Please note that you can also generate alternative pie charts/bar charts by grouping for nrg_bal/siec /unit by selecting these at step 7, or by creating different aggregations at step 8. In addition to this, you can customize the chart options by clicking the CUSTOMIZE tab.
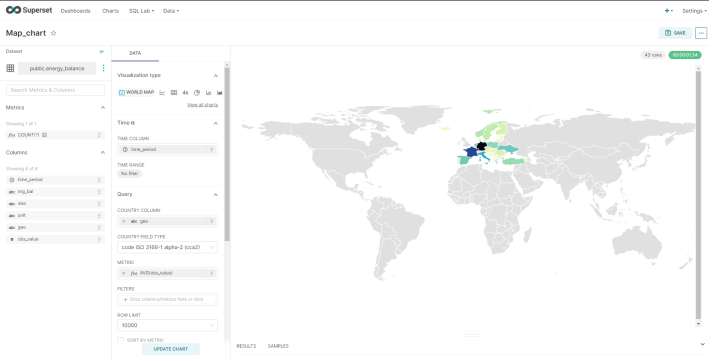
Create a World map chart
- In the navbar, click on Charts and then on the button + CHART.
- In the Choose a dataset section, select the dataset connected in the previous step.
- In the Choose chart type section, select the World map chart and click on CREATE NEW CHART.
- Assign the new chart a name by editing the text Add the name of the chart.
- In the DATA tab, select time_period as TIME COLUMN.
- In the DATA tab, select geo as COUNTRY COLUMN and code ISO 3166-1 alpha-2 (cca2) as COUNTRY FIELD TYPE.
- In the DATA tab, select geo as DIMENSIONS.
- In the DATA tab, click on Add metric > SIMPLE and select obs_value as COLUMN and SUM as aggregate. Click on SAVE.
- In the DATA tab, click on Add filter > SIMPLE, select geo as column, Not equal to as operator and EA19 as Filter value. (Repeat the exact same operation twice by putting EU27_2020 and EU28 as filter value. This will exclude these columns from the chart, since these rappresents the aggregated values at EU level).
- Click on RUN and on SAVE to save the created chart.
Create a dashboard and populate it with charts
- In the navbar, click on Dashboards.
- Click on the " + DASHBOARD " button. This will create a new dashboard that will contain our data visualizations.
- Assign a name to the dashboard by editing the text [untitled dashboard].
- On the right part of the dashboard page, in the CHARTS tab drag and drop the desired charts from the list of the available ones.